Air pollution is one of the highest causes of premature death in the world. It accounts for more fatalities than alcohol use, unsafe water, and unsafe sanitation, combined.1 The World Health Organization estimates that ambient air pollution and household air pollution cause 6.7 million premature deaths annually.2 Importantly, these mortalities disproportionately occur in the developing world where access to energy is less readily available.3 For instance, a lack of clean cooking infrastructure contributes to 3.7 million premature deaths annually, 60% of which occur in Africa.4
Reducing ambient and indoor air pollution will require expanding electricity access in the developing world and transitioning away from the use of charcoal, dung, and coal to meet heating, cooking, and energy needs. Resolving this challenge has proven to be difficult. Economic freedom helps by generating more wealth, which results in more public and private investment in cleaner fuels, more efficient technologies, and pollution abatement. Strong institutions reduce cronyism and hold polluters accountable.
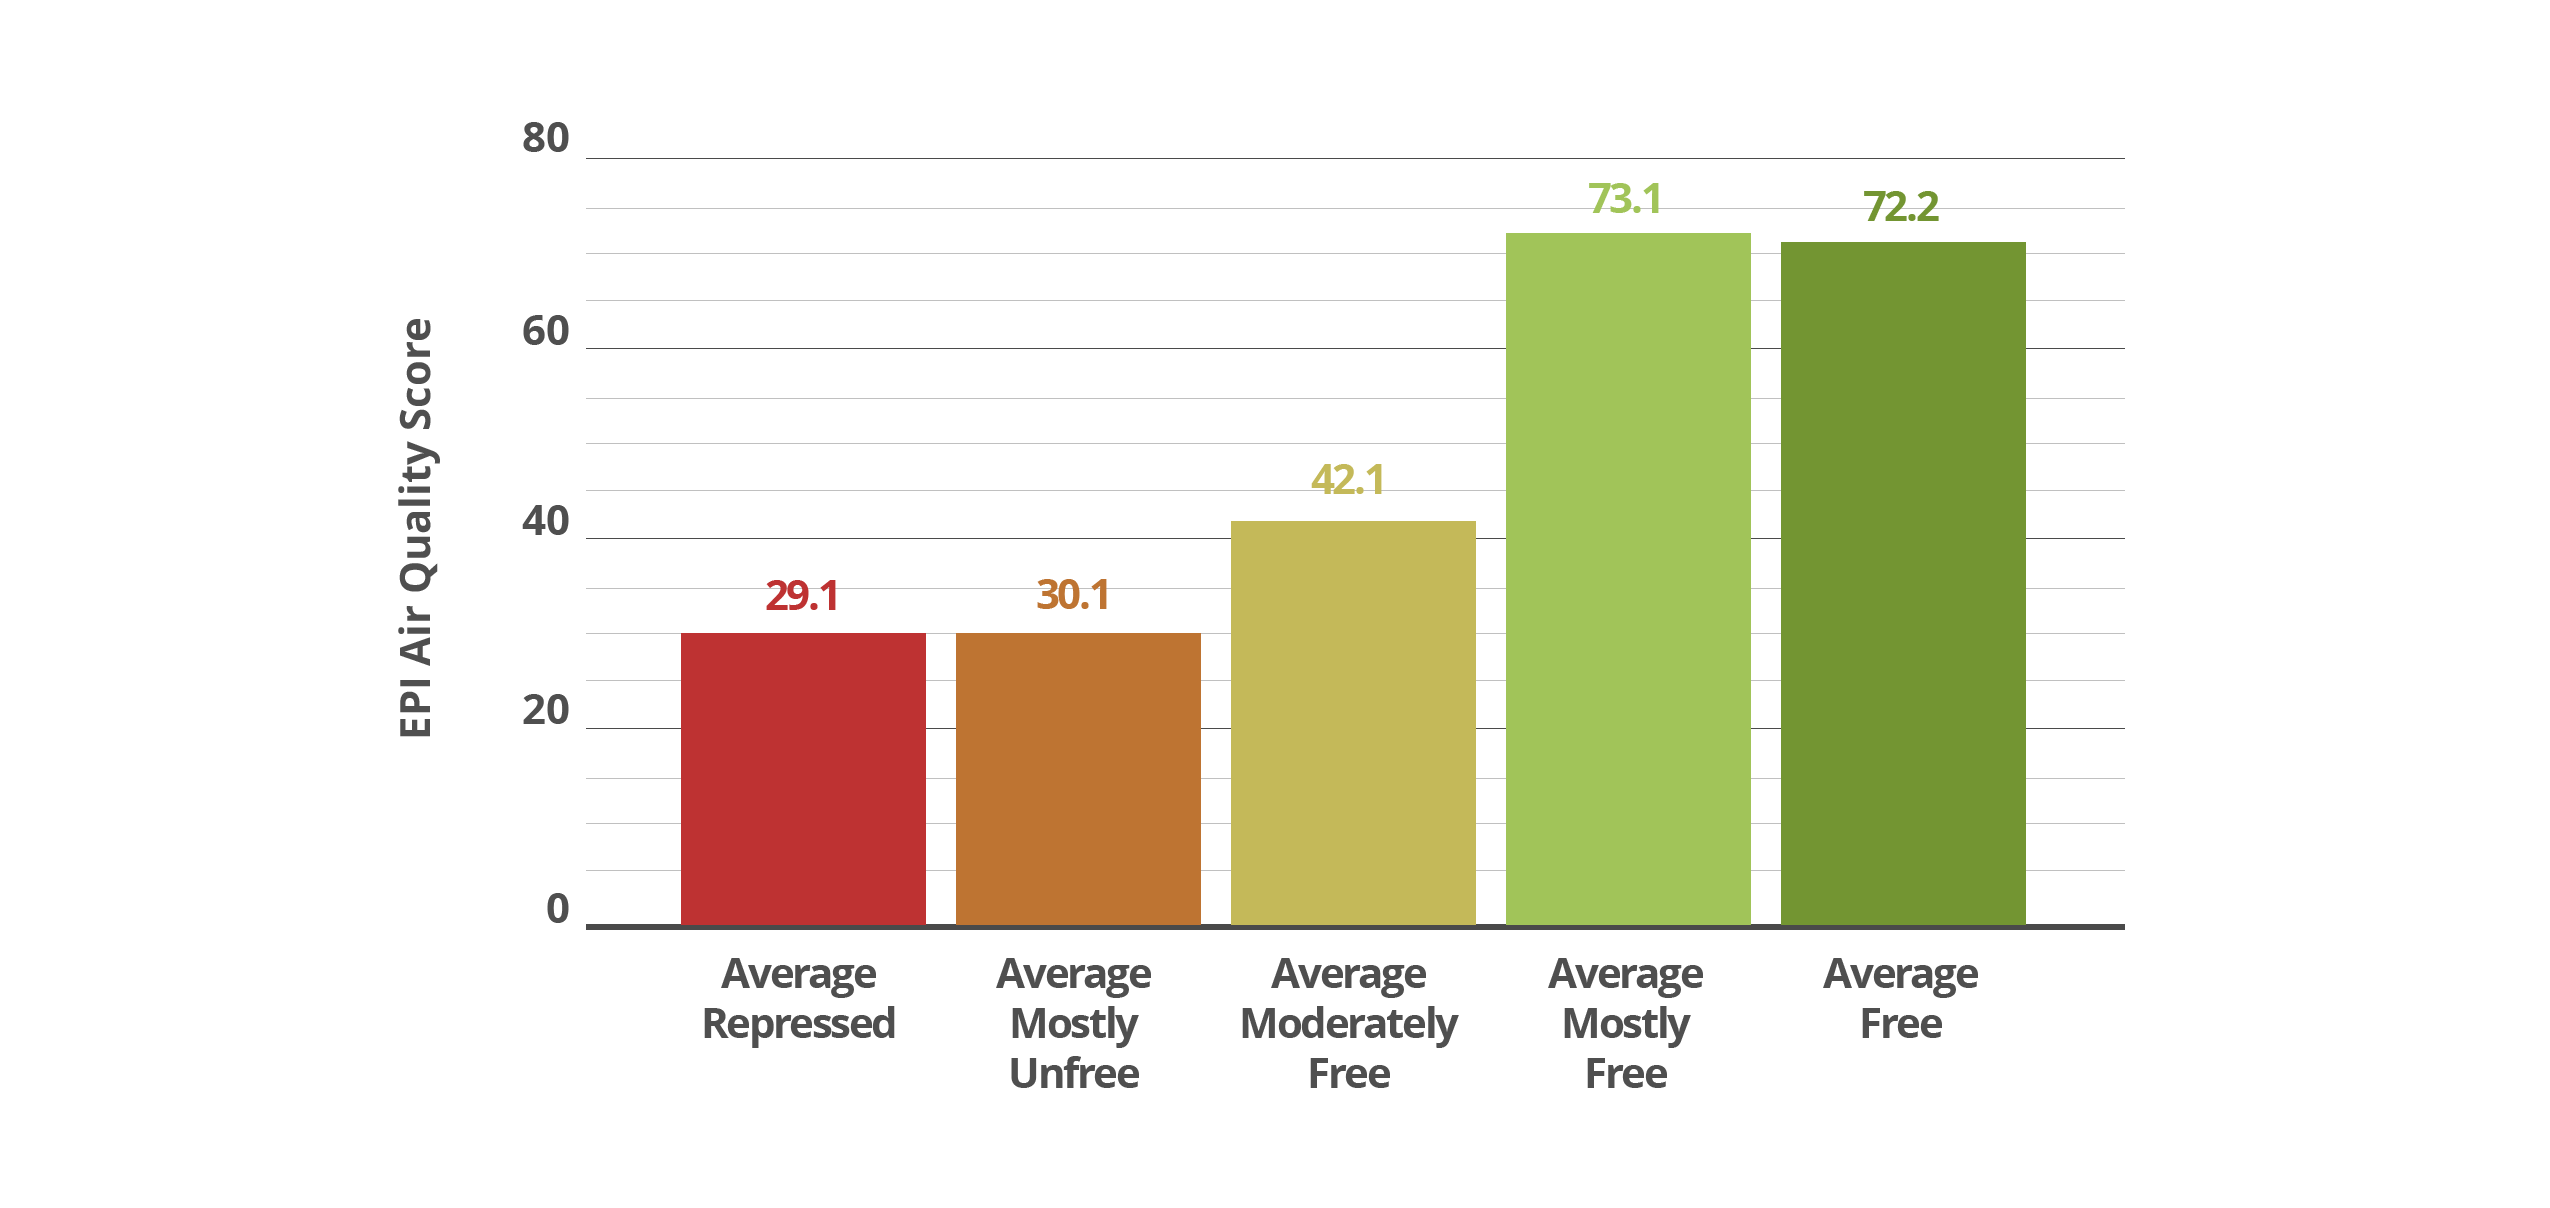
When comparing the air quality index of Yale’s Environmental Performance Index, which “consists of seven indicators: PM2.5 exposure, household solid fuels, ozone exposure, nitrogen oxides exposure, sulfur dioxide exposure, carbon monoxide exposure, and volatile organic compound exposure,”3 and The Heritage Foundation’s Index of Economic Freedom, one finds a strong positive correlation (0.636).
Air Quality and Economic Freedom
Air Quality and Economic Freedom
The relationship between economic freedom and air pollution has been explored by previous literature. Writing for the Fraser Institute in 2014, Joel Wood and Ian Herzog find, “a permanent one-point increase in the Economic Freedom of the World index results in a 7.15% decrease in concentrations of fine particulate matter in the long-run, holding all else equal.”5
Air Quality and Government Integrity
IEF’s Government Integrity subindex plays a pivotal role in countries’ air pollution scores as evidenced by the two indices’ strong, positive correlation (0.786).6 One example where the role of high-quality institutions has had an impact on energy access and air pollution is the electricity sector. Privately-owned electricity utilities are unique to the U.S. and Western countries. In much of the developed world, electricity utilities are owned and operated by the central government, as the private market is not well-enough established to provide electricity to consumers.7 Furthermore, a lack of adequate grid infrastructure and low activation rates, especially in rural areas, borne by high upfront costs and investment disincentives private companies from entering emerging markets.8 Because of these factors, the impetus of expanding access to electricity falls on the government.
This strategy can prove successful in countries whose governments are not corrupt. However, in countries where fraud is rampant, a publicly owned electricity system can lead to blackouts, a lack of access to electricity (especially in rural areas). Without reliable power or a functional grid, families must heat and power their homes with high-polluting energy sources such as biomass, wood, and agricultural waste.
One notable instance is in South Africa, which ranks 144 out of 175 in Yale’s Air Quality rankings and low on IEF’s rule of law scores. Corruption at state-owned Eskom has led to rolling blackouts and higher energy costs for consumers. As Paul Burkhardt of Bloomberg reported:
On a late Thursday afternoon last November, in the midst of rolling blackouts implemented by South Africa’s state-owned electricity company, a contractor at a power station in the eastern Mpumalanga province pulled a plug connected to one of the site’s main generation units.
The unit subsequently broke down, ensuring yet another day of nationwide outages.
The worker later confessed that he had intentionally sabotaged the machinery — resulting in $1 million in damages and almost $6 million in lost revenue — so his employer would be hired to make the repairs, according to a statement and report presented to lawmakers by Eskom Holdings SOC Ltd.
This wasn’t an isolated event — rather, it was one of more than 760 criminal incidents targeting Eskom operations over a 90-day period ending in December. At every step of its supply chain, the utility, which is responsible for producing 90% of South Africa’s energy, has had to defend itslf against armed robbery, fuel theft, sabotage and corruption — all of which are increasing the risk of a complete power outage that could devastate a country teetering on the brink of recession.9
As the most industrialized nation on the continent, South Africans enjoy near universal availability of electricity. However, government corruption may lead to recession and less adequate power. The impact of corruption in countries that are not as industrialized is far more realized, as they do not have the existing grid infrastructure and energy resources that South Africa uses.
Prosperity and Clean Air
Another relevant factor for a country’s air quality is its economic well-being. Returning to the concept of the Environmental Kuznets Curve, higher levels of economic growth increases air pollution but equips countries with the resources necessary to do something about it. One way to measure this is to examine the relationship between prosperity and air quality. The Atlantic Council’s Freedom and Prosperity Indexes provides an annual empirical snapshot of the current distribution of freedom and prosperity around the globe. The Atlantic Council’s Freedom Index evenly weighs a country’s Legal Freedom,10 Economic Freedom, 11 and Political Freedom. 12
The Prosperity Index has six indicators, all of which receive equal weight.13 A country’s score on the Freedom Index and Prosperity Index are closely correlated (0.80 correlation coefficient), meaning that as a nation becomes more prosperous, it tends to become freer and vice versa.
A similarly significant positive relationship exists between the Atlantic Council’s Prosperity Index and Yale’s Air Quality subindex (0.872).
The result of this relationship is not surprising. Countries will prioritize meeting the basic needs of citizens before addressing the environmental byproducts created by meeting those needs. Higher living standards will allow citizens and governments to invest in cleaner cooking systems, reliable infrastructure, and more innovative technologies. Countries with strong institutions and property rights protections pass laws and regulations to reduce environmental degradation.
Increasing a country’s level of prosperity is integral to reducing indoor and outdoor air pollution-caused deaths. Research from Our World In Data shows that as per capita GDP increases, death rates from outdoor pollution increase before falling dramatically—which further lends credence to the EKC.14 Wealthier people living in more prosperous countries have much lower death rates from indoor air pollution.15 Climbing the economic ladder is one of the most effective ways to reduce air pollution-related deaths in the developing world.
The world’s Least Developed Countries (LDCs), which the United Nations defines as “low-income countries confronting severe structural impediments to sustainable development [that] are highly vulnerable to economic and environmental shocks and have low levels of human assets,” are a testament to this. As seen in the chart below, 22 LDCs are heavily reliant on biomass and waste, such as dung and crop waste (which are large contributors of indoor air pollution) and oil to meet their energy needs.16
| Country | Fossil Fuels (% of total energy supply) | Biomass & Waste (% of total energy supply | Clean energy sources (Hydropower, Renewables, etc) |
| Angola | 41.93% | 50.18% | 7.89% |
| Bangladesh | 81.94% | 18.06% | 0.00% |
| Benin | 46.04% | 53.95% | 0.01% |
| Cambodia | 53.34% | 42.07% | 4.59% |
| Dem. Rep. Congo | 2.52% | 94.19% | 3.30% |
| Eritrea | 21.15% | 78.71% | 0.14% |
| Ethiopia | 10.02% | 87.17% | 2.80% |
| Haiti | 20.02% | 79.76% | 0.22% |
| Madagascar | 9.99% | 88.85% | 1.16% |
| Mozambique | 18.99% | 68.87% | 12.14% |
| Myanmar | 48.53% | 47.49% | 3.98% |
| Nepal | 26.84% | 69.54% | 3.62% |
| Niger | 21.20% | 78.74% | 0.06% |
| Rwanda | 9.12% | 90.84% | 0.03% |
| Senegal | 56.07% | 42.80% | 1.13% |
| South Sudan | 74.56% | 25.32% | 0.12% |
| Sudan | 32.52% | 62.95% | 4.53% |
| Tanzania | 16.79% | 82.06% | 1.15% |
| Togo | 15.07% | 84.56% | 0.37% |
| Uganda | 9.82% | 88.13% | 2.05% |
| Yemen | 93.95% | 4.60% | 1.46% |
| Zambia | 18.97% | 70.95% | 10.08% |
The heavy use of biomass and waste is particularly troubling because it is primarily used to cook meals or heat and power small spaces.3 Burning these sources produces particulate matter that either worsen underlying health conditions or create new problems.3 The use of these materials also contributes to deforestation, which further reduces air quality in regions.
Industrialized countries must allow emerging economies to develop. Restricting energy access with top-down policies will trap people in poverty and poor living conditions, exposing them to higher levels of pollution. Policies rooted in economic freedom will help people in developing countries achieve higher levels of prosperity, greater public health, and healthier environments.
Prosperity and Air Quality
Prosperity and Air Quality
(Least to most Prosperous)

Death rate from indoor air pollution vs. GDP per capita
Death rate from outdoor air pollution vs. GDP per cap
- Hannah Ritchie and Max Roser, “Air Pollution,” Our World in Data, January 2021, https://ourworldindata.org/air-pollution[↩]
- World Health Organization, “Household air pollution,” November 28, 2022, https://www.who.int/news-room/fact-sheets/detail/household-air-pollution-and-health[↩]
- Ibid.[↩][↩][↩][↩]
- International Energy Agency, “A Vision for Clean Cooking Access for All,” July 2023, https://www.iea.org/reports/a-vision-for-clean-cooking-access-for-all/[↩]
- Joel Wood and Ian Herzog, “Economic Freedom and Air Quality,” Fraser Institute, April 2014, https://www.fraserinstitute.org/sites/default/files/economic-freedom-and-air-quality.pdf[↩]
- The Heritage Foundation scores based on the perception of corruption, bribery risk, and control of corruption including “capture” of the state by elites and private interests. [↩]
- Alkhuzam et al, “Private versus public electricity distribution utilities: Are outcomes different for end-users?”, The World Bank, May 3, 2018, https://blogs.worldbank.org/developmenttalk/private-versus-public-electricity-distribution-utilities-are-outcomes-different-end-users[↩]
- Bos et al, “Benefits and challenges of expanding grid electricity in Africa: A review of rigorous evidence on household impacts in developing countries,” Energy for Sustainable Development, June 2018, https://www.sciencedirect.com/science/article/abs/pii/S0973082617308074[↩]
- Paul Burkhardt, “Rampant Corruption at Energy Provider Drags Down South Africa,” Bloomberg, May 8, 2023, https://www.bloomberg.com/news/features/2023-05-08/crime-corruption-are-dragging-down-south-africa-s-energy-giant[↩]
- Measured by Bureaucracy & Corruption, Security, Clarity of the Law, Judicial Independence and Effectiveness, and Informality[↩]
- Measured by Women’s Economic Freedom, Investment Freedom, Property Rights, and Trade Freedom [↩]
- Measured by Elections, Civil Liberties, Political Rights, and Legislative Constraints on the Executive. For more, see, https://www.atlanticcouncil.org/in-depth-research-reports/report/prosperity-that-lasts-the-2023-freedom-and-prosperity-indexes/[↩]
- Measured by Education, Income, Health, Inequality, Environment, and Minority Rights. For more see https://www.atlanticcouncil.org/in-depth-research-reports/report/prosperity-that-lasts-the-2023-freedom-and-prosperity-indexes/[↩]
- “Death rate from outdoor air pollution vs. GDP per capita, 2019,” Our World in Data, https://ourworldindata.org/grapher/outdoor-pollution-rate-vs-gdp[↩]
- “Death rate from indoor air pollution vs. GDP per capita, 2019,” Our World in Data, https://ourworldindata.org/grapher/death-rates-from-indoor-air-pollution-vs-gdp-per-capita [↩]
- LCD definition: https://www.un.org/development/desa/dpad/least-developed-country-category.html Energy data was sourced from IEA: https://www.iea.org/countries Full spreadsheet found here 2023 Free Economies Data[↩]