
Key Takeaways
- Climate science shows that the world is getting warmer and sea levels are rising, and recent warming is driven by human influence. Global surface temperatures have increased 1.1 degrees Celsius since 1880.
- Changes in resource consumption, technologies, public policy, population growth, and economic development will all affect what future emissions scenarios look like, and consequently, how much warming may occur.
- Understanding climate risk is essential for policymakers, the private sector, and the public, and the best understanding of science must be our guiding tool for climate mitigation and adaptation. Though they cannot be completely ruled out, the worst-case climate outcomes are becoming increasingly unlikely. There is still risk and cost for the current emissions trajectory, and policymakers should still focus on addressing such higher probability, less catastrophic outcome scenarios, but the imminent doom and gloom projections are far less likely than alarmists purport them to be.
- Communicating uncertainty in future climate science scenarios is not synonymous with climate science denialism, but instead helps us understand future risks and probabilities. Scientific uncertainty is not an excuse for inaction, either.
- Current and future warming poses a risk. It is critical to assess the spectrum of that risk, the likelihood it may happen and to consistently evaluate how that risk and other probabilities change over time. We must evaluate whether specific climate science policies will reduce risk and show improved adaptability. We must also evaluate what those policies will cost American families, as consumers and as taxpayers.
Introduction
When David Wallace-Wells published an essay on climate change for New York magazine in 2017, the prestigious journalist had a dire warning for the future of our planet: “It is, I promise, worse than you think.” In February 2019, he published a book called The Uninhabitable Earth.
A mere ten months later, Wallace-Wells penned another article for New York, “We’re Getting a Clearer Picture of the Climate Future—and It’s Not as Bad as It Once Looked.” For many, that might feel like quite the dramatic turnaround in a relatively short amount of time. How can we go from an uninhabitable earth to “it’s not as bad” in less than a year?
The disparity in headlines is by no means a criticism of Wallace-Wells; he has thoroughly researched, followed and published on climate science. And his December 2020 article still expresses serious concern about the costs and threats of climate change. The flip side is also true. Notable climate science “skeptics” worry more about climate change than they used to and believe we should take action to mitigate the risks.
Importantly, the contrast in headlines speaks to how science, policy and technology evolve over time (and sometimes rather quickly). It speaks to the immense challenge of communicating risk and uncertainty to inform policymakers and the public. Reading one article without the other could easily skew one’s perception of the present and future costs of climate change or the connection between anthropogenic warming and extreme weather. As new knowledge surfaces and understanding of climate science improves, it is reasonable to change one’s mind. It is only through the accumulation of knowledge that we can better understand how the climate is changing, what risks are associated with these changes, and how to cost effectively reduce those risks. Science should be a useful guide for public policymakers as they consider costs, benefits, and trade-offs.
Too often, though, politicians, pundits and activists communicate climate science with cherry-picked data, half-truths or downright misinformation. Communicating scientific findings from an academic journal to a newspaper and or boiling them down to a tweet can be like the children’s game of telephone where the message becomes quite distorted along the way. Then, a tweet with a distorted message or incomplete information gets retweeted tens of thousands of times. This problem is not
unique to climate science; nonetheless, it makes communicating the risk and uncertainties of climate change more difficult, especially when the information presented often reaffirms preconceived beliefs. Even saying the science is or isn’t settled means different things to different people.
Condensing climate science and conveying the uncertainties is no easy task. Ron Bailey, Reason’s science correspondent, writes:
Climate science is a massive enterprise involving research into a vast array of topics including atmospheric physics, ocean and atmospheric currents, solar irradiance, adjustments in temperature records, the effects of atmospheric aerosols, how forests and fields react to rising carbon dioxide, trends in cloudiness, heat storage in the deep oceans, changes in glaciers and sea ice, to name just a few. A simple Google Scholar search using the terms climate change and global warming returns more than 2.6 and 1.7 million results each. Just searching glaciers and climate change returns 124,000 results.
Within those results, it is relatively easy to craft a narrative backed by peer-reviewed literature and mainstream climate science to fit a specific agenda. This primer is not meant to be an exhaustive literature review of all climate science. Much more qualified experts have done that, and many resources exist to take a deep dive into climate science. Instead, the objective is to provide a general understanding and comprehensive snapshot of what the climate science says on temperature trends, sea level rise, and extreme weather attribution, where uncertainty exists, and how climate scientists examine our planet’s future. Discussing uncertainty in future climate scenarios is not synonymous with climate denialism, but instead helps us understand future risks and probabilities. Scientific uncertainty is not an excuse for inaction, either. Understanding climate risk is essential for policymakers, the private sector and the public, and the best understanding of climate science must be our guiding tool for climate mitigation and adaptation.
A Brief History of Climate Change & Climate Science
Well before any human activity, the earth has fluctuated between warming and cooling phases for millions of years. Climatologists, geologists, paleontologists, and other scientists measure how temperatures have changed over time by analyzing samples from natural environments such as tree rings, ice core samples, or ocean sediment. Dating back hundreds of millions of years, the earth has experienced glacial periods where ice sheets may have reached the equator and warming where crocodiles and palm trees were found in the ice-free Arctic.4 One of the largest drivers of natural climate variability over time has been small changes in the shape and wobble of the earth’s orbit around the sun, which affects how much sunlight hits glaciers in the Northern Hemisphere.
In the brief lifespan of humanity, we’ve lived through the Little Ice Age (LIA), which lasted roughly from 1300-1850 B.C. The precise drivers of the LIA are unknown, but researchers have pointed to volcanic activity, changes in the earth’s orbit, changes in ocean circulation, and a decrease in solar radiation. In a 2012 study, National Center for Atmospheric Research scientist Bette-Otto Bleisner explained that volcanic eruptions “could have triggered a chain reaction, affecting sea ice and ocean currents in a way that lowered temperatures for centuries.” Other studies have suggested that some of the cooling and glacier expansion in the Arctic may have occurred spontaneously. In a 2020 article in Science Advances, the authors conclude, “While consistent with external forcing theories, the onset and development are notably similar to modeled spontaneous abrupt cooling enhanced by sea-ice feedbacks. These results provide evidence that marked climate changes may not require an external trigger.” Further, the authors suggest that large amounts of sea ice flowing from the Arctic Ocean to the North Atlantic resulted in cooling across Europe.
The middle of the 19th century was the first time scientists began to better understand how the atmosphere reflects and absorbs solar energy. In other words, scientists discovered the greenhouse effect. Irish physicist John Tyndall tested and discovered that water vapor, carbon dioxide, and nitrous oxide (which make up about one percent of the atmosphere) were responsible for absorption of solar radiation and the emission back down to the surface. Eunice Foote’s similar conclusion (though conducted with less scientific rigor) three years prior to Tyndall’s publications is also worth highlighting as groundbreaking research in identifying the greenhouse gas effect. In a 2018 climate science primer, Massachusetts Institute of Technology atmospheric science professor Dr. Kerry Emanuel provides a clear explanation of the how greenhouse gas effect works:
When the greenhouse gases (and clouds, which also act as greenhouse agents) absorb infrared radiation, most of which comes from the surface and lower layers of the atmosphere, they must reemit radiation, otherwise the temperature of the atmosphere would increase indefinitely. This reemission occurs in all directions, so that half the radiation is emitted broadly downward and half broadly upward. The downward part is absorbed by the earth’s surface or lower portions of the atmosphere. Thus, in effect, the earth’s surface receives radiant energy from two sources: the sun, and the back radiation from the greenhouse gases and clouds in the atmosphere […].
Now here is something surprising: on average the earth’s surface receives almost twice as much radiation from the atmosphere as it does directly from the sun, mostly because the atmosphere radiates 24/7, while the sun shines only part of the time. This is how powerful the greenhouse effect is. The surface must get warm enough to lose enough heat to balance both sunlight and back-radiation from the atmosphere and clouds within it. That is the greenhouse effect.
Carbon dioxide concentrations have risen and fallen with changes in temperature well before any industrial activity. When more sunlight hits the planet, it triggers several feedback loops where warming increases carbon dioxide concentrations, which in turn causes more warming. For instance, natural warming has increased carbon dioxide and methane released from oceans and thawing and decomposing permafrost. Before industrial activity, “CO2 mostly lags temperature, suggesting that the CO2 variations were caused by the warming and cooling, not the other way around.” Pre-industrial levels of carbon dioxide concentrations in the atmosphere hovered around 280 parts per million (ppm); they are now close to 420 ppm.
20th Century Warming and Human Activity’s Influence
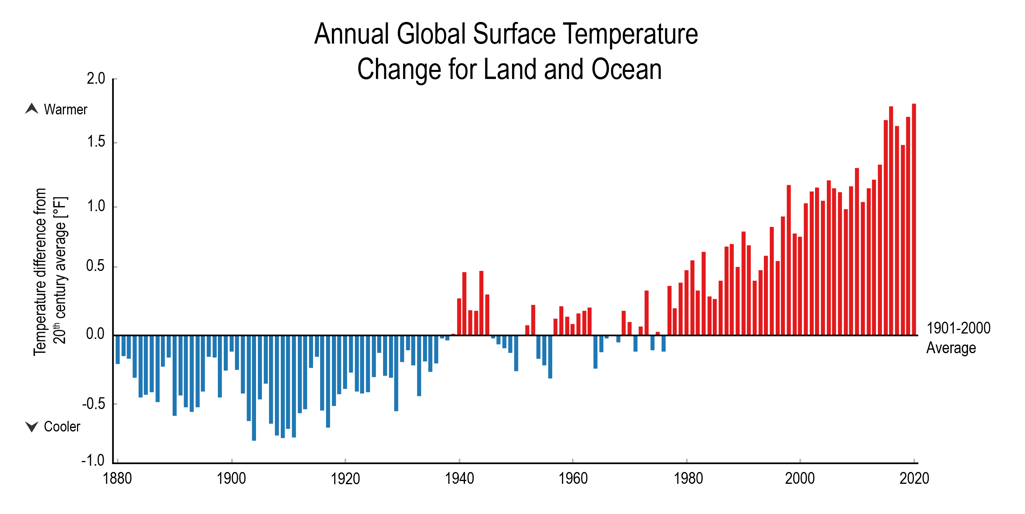
The world is getting warmer and sea levels are rising. Global surface temperatures have increased 1.1 degrees Celsius since 1880.18 Roughly two-thirds of that global surface warming has occurred since 1975. As the United Nations Intergovernmental Panel on Climate Change (IPCC) recently and unequivocally stated, carbon dioxide and other greenhouse gas emissions from human activity are the predominant factors driving global warming. Observational data from the Southern Great Plains and the North Slope of Alaska provides evidence of how increased carbon dioxide emissions have resulted in more heat trapped in the atmosphere.
In August 2021, the IPCC published Working Group 1 (of 3)’s contribution to the Sixth Assessment Report (AR6). Building off the 2013 fifth assessment, the report observes that:
The likely range of human-induced warming in global-mean surface air temperature (GSAT) in 2010–2019 relative to1850–1900 is 0.8°C–1.3°C, encompassing the observed warming of 0.9°C–1.2°C, while the change attributable to natural forcings is only −0.1°C to +0.1°C. The best estimate of human-induced warming is 1.07°C. Warming can now be attributed since 1850–1900, instead of since 1951 as done in AR5, thanks to a better understanding of uncertainties and because observed warming is larger.
AR5 stated that it was extremely likely that at least half the warming from 1951-2010 was driven by human activity, though many experts estimated that more than 100 percent of recent warming was human-induced, with other factors (volcanoes, aerosols) offsetting some of that warming.
Global sea levels have risen more than 8 inches since 1870 with sea levels rising nearly double the long-term average over the last 28 years. AR6 finds, “Global mean sea level increased by 0.20 [0.15 to 0.25] m between 1901 and 2018. The average rate of sea level rise was 1.3 [0.6 to 2.1] mm yr–1 between 1901 and 1971, increasing to 1.9 [0.8 to 2.9] mm yr–1 between 1971 and 2006, and further increasing to 3.7 [3.2 to 4.2] mm yr–1 between 2006 and 2018 (high confidence). Human influence was very likely the main driver of these increases since at least 1971.” A 2018 National Academy of Sciences paper used satellite data to find accelerated sea level rise, and a 2019 article in Nature Climate Change found an accelerated increase in global mean sea level since 1960s.
Other natural factors can also play a role and sea level rise will challenge some coastal communities more than others. The National Oceanic and Atmospheric Administration (NOAA) describes how numerous conditions uniquely affect specific coastlines, saying, “Sea level rise at specific locations may be more or less than the global average due to many local factors: subsidence, upstream flood control, erosion, regional ocean currents, variations in land height, and whether the land is still rebounding from the compressive weight of Ice Age glaciers.”
The Arctic is warming particularly fast, with sea ice in May of 2022 measured at 158,000 square miles (about the size of California) below average. Antarctic sea ice extent has had less of a clear trend. May of 2022 tied 2018 for the fifth-smallest sea extent in the 44 years of record keeping (322,797 square miles below average). However in May of 2021, Antarctic sea ice extent was 3.99 million square miles above average, though it grew at a below average pace. Fueled in part by an El Nino event, a natural and temporary warming in the Pacific, the World Meteorological Association recorded record low Antarctic sea ice extent in June 2023.

How Climatologists Take the Earth’s Temperature
Temperature records are taken at weather stations, on ships and buoys, and by satellite to measure global surface temperatures on earth. Whether collected through weather balloons, satellites, on rooftops, or on a ship, climatologists must adjust the data sets to account for biases. For example, urban areas experience higher temperatures because of the heat island effect, where buildings, parking lots and roads re-emit the sun’s heat more than natural landscapes. Satellite accuracy suffers from decay in the technology and orbital drift. With all record collection tools, the technologies to accurately record temperatures and implement quality control to correct for errors have vastly improved over time. There is some debate as to which temperature sets are best to use and how well models predicted observed warming. Many performed very well, while others were far from predictive.
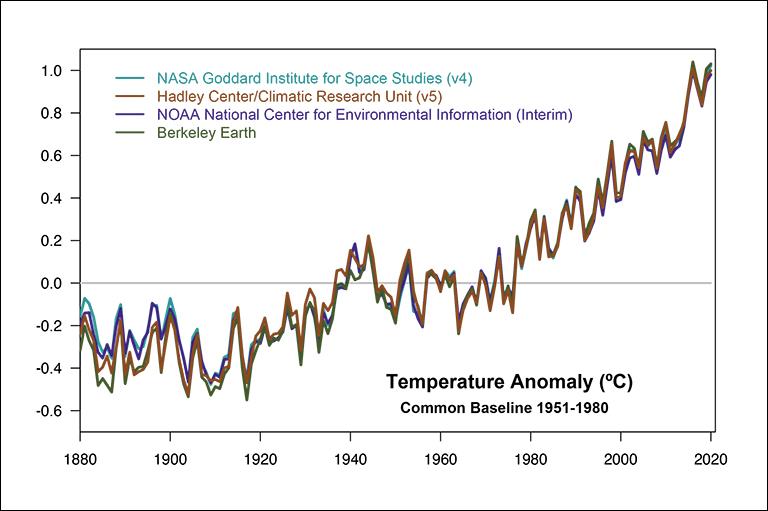
NASA alone collects data from more than 20,000 weather stations, and five separate surface temperature measurement sets (they did not all begin at the same time) show similar ebbs and flows in temperatures (all showing a trend of increased warming). As Dr. Emanuel notes, the Berkeley Earth data set “was undertaken by a group led by a physicist who was skeptical of the way atmospheric scientists had made their estimates.” Nonetheless, the temperature sets “agree with each other quite well after about 1900 and especially well after about 1950. The better and better agreement reflects the increasing number and quality of temperature measurements around the planet.”
The per decade rate of warming since 1981 of 0.18 degrees Celsius (0.32 degrees F) is more than double the decadal average of 0.08 degrees C (0.14 degrees F) since 1880. Several temperature data sets collected around the world report warming of .18 degrees C to .20 degrees C per decade. A 2023 paper in the Journal of Geophysical Research: Atmospheres from NOAA’s Center for Satellite Applications and Research recorded satellite data for temperature trend for the total troposphere and found the trend to be .14 degrees C of warming from 1979-2021, with a greater rate of warming after 2002.

Although it is clear human influence has warmed the atmosphere, oceans and global surface, explaining the drivers of early 20th century warming is more challenging. Climate expert Joseph Majkut asserts that it is difficult to disentangle “the combined effects of natural variability, external factors, and human influence on the temperature changes […] because the observations themselves are more uncertain, data coverage is less complete and conclusions are necessarily less confident.” Yet, climate experts have made progress in examining and explaining which human-induced and natural variations explain pauses or slowdowns in warming, notably from 1945-1975 and from 1998-2013, and why those temperature trends deviate from model projections. The explanations include the use of aerosols, volcanic activity, solar activity, changes in ocean temperature (particularly in the tropical Pacific) and ocean heat uptake.
Scientists have made significant improvements in understanding how natural factors and human activities influence the global surface temperatures, extreme weather, and specific regional weather patterns. Even so, the larger scientific bodies express a great deal of uncertainty as well. In the latest IPCC report, attribution of human activity to specific extreme weather (frequency and intensity) and projections about future warming and impacts are all made with varying degrees of likelihood and confidence.
Changes in resource consumption, technologies, public policy, population growth, and economic development will all affect what future emissions scenarios look like, and consequently, how much warming may occur. These variables, as well as increasing our understanding of how human activity and natural variability affect the climate (especially regionally and locally), are critical to better understanding the science, communicating the risk and uncertainty of future climate change, and helping guide public policy decisions.
How Much Warming Can We Expect?
Just how warm is the planet going to get? Ask a climatologist, and he or she may provide the unsatisfying, economist style answer: “it depends.” That’s because future warming depends on many different factors. One central question that climatologists have tried to answer for more than a century is: how will global temperatures change from a doubling of carbon dioxide concentrations in the atmosphere? More specifically, equilibrium climate sensitivity (ECS) refers to how the climate and global surface temperatures will adjust over time to a doubling of CO2 emissions. A higher ECS would indicate faster warming and more urgency to reduce greenhouse gas emissions while a lower ECS would buy more time.
In 1979, the National Academy of Science provided an ECS range of 1.5 degrees Celsius to 4.5 degrees Celsius. The IPCC’s First Assessment Report in 1990 provided the same range, as did the Fifth Assessment Report 23 years later. Although AR5 included the same range, the 2013 report included Coupled Model Intercomparison Project Phase 5 (CMIP5) models, which produced a range of 2.1C to 4.7C.
AR6, which uses CMIP6 models, narrowed the range a bit, to a likely range of 2.5 to 4C and a very likely range of 2 to 5C. Lower climate sensitivity would certainly be good news, but given the existing range of ECS estimates, climatologists have not altogether ruled out higher ECS estimates even though the most upper bound ECS in CMIP6 appear unlikely. The AR6 Working Group 1 (WG1) chapter has medium confidence that sensitivity will be lower than 5C.
The bad news is that the AR6 WG1 has even higher confidence that ECS will not be on the lowest of the range. While the central estimate from AR6 WG1 is 3C, the authors conclude with high confidence that the ECS is greater than 1.5C.
Authors in a 2018 study published in the American Meteorological Society’s Journal of Climate produced an estimated median ECS of 1.66C, with a range of 1.15 to 2.27C. Another 2018 study in Nature analyzed global temperature variability using historical records on long-term warming and concluded with 66 percent confidence (likely range) that the ECS ranged from 2.2 to 3.4C. The authors estimate a less than one percent probability of ECS being 4.5C and a less than three percent probability of ECS being 1.5C. Similarly, a 2020 article in Reviews of Geophysics found the lower bound and upper bound ranges of ECS to be more improbable and estimated a likely range of 2.6–3.9C.
It is encouraging to see AR6 WG1 narrow the ECS range as that range and resolving the differences between model projections and observed behavior in the earth’s climate system remains a key challenge for the climate science community. Continued progress in refining the ECS range will serve to paint a clearer picture of how much warming we can expect and when.
One notable criticism of CMIP6 models, and a broader debate of climate models, is that they run hot. An analysis of 40 of the CMIP6 models (of more than 100 to be published) has thus far produced a likely range of 1.8-5.6C. However, several prominent climatologists are skeptical of the likelihood of the upper bound ECS estimates, “arguing that they are inconsistent with evidence from paleoclimate records and other lines of evidence.” When climatologists look at ice core data or the increased observed warming over the 20th and 21st centuries, some of the models have overestimated the observed warming and therefore conclude the high ECS estimates produced by CMIP6 are unlikely.
Academic teams and climate modelers have suggested that positive cloud feedback and the ways clouds and aerosols interact with each other in the model may explain the higher upper bound ECS estimates. A January 2021 paper in Geophysical Research Letters reached a similar conclusion that the CMIP6 models that best simulate the earth’s complex climate system are the ones with lower ECS estimates. As a result, climate experts have warned the climate community it should not rely on models that fail to reproduce historical trends, because doing so could inaccurately communicate the likelihood of worst-case scenarios. A May 2022 article in Nature Commentary argued, “The sixth and latest IPCC assessment weights climate models according to how well they reproduce other evidence. Now the rest of the community should do the same.”
A Look at Different Emissions Pathways
Aside from changes in natural internal variability (with some natural causes more predictable than others), future emissions scenarios depend on numerous socioeconomic factors. Changes in population, economic growth, innovation and technological progress, energy fuel choices and government policy all factor into how rapidly or slowly greenhouse gas emissions will grow over time. Some variables may be more easily predictable than others and some can change rather quickly; nevertheless, predicting what the future looks like through the year 2100 (and beyond) is no easy task. Climate modelers have choices for which socioeconomic pathways they can input into models to project future greenhouse gas emissions and concentrations in the atmosphere. Models use Representative Concentration Pathways (RCPs) and Shared Socioeconomic Pathways (SSPs).
The IPCC 5th Assessment Report as well as many peer-reviewed articles that model climate scenarios use RCPs, which consist of four different pathways (RCP8.5, RCP6, RCP4.5 and RCP2.6). The numbers represent the total radiative forcing levels measured in Watts per square meter and each follows a pathway through 2100. Radiative forcing is:
The difference between incoming and outgoing radiation […]. In the same way as applying a pushing force to a physical object will cause it to become unbalanced and move, a climate forcing factor will change the climate system. When forcings result in incoming energy being greater than outgoing energy, the planet will warm (positive RF). Conversely, if outgoing energy is greater than incoming energy, the planet will cool.
The scariest and by far most costly climate future comes from RCP8.5. The good news is that RCP8.5 appears increasingly unlikely and extremely improbable. The socioeconomic inputs underpinning RCP8.5 assume significantly high population growth, low technological development, relatively stagnant economic growth, no change in policy, and high energy-intensity (including an implausible expansion of coal consumption), all of which results in extremely high emissions growth. While coal consumption globally will continue for the foreseeable future, a 2017 study in Energy Economics emphasized, “Illustrating coal as a practically unlimited backstop supply is inconsistent with the current state of coal markets, technology, and reserve estimates.” Moreover, a study published in 2020 projects that the global population in 2100 will be about 2 billion people fewer than United Nations projections.
While RCP8.5 cannot be fully ignored as our potential climate future, many unrealistic changes would have to occur (slower technological advancements, a substantial return and expansion of coal, etc.) to make RCP8.5 a more likely pathway. For instance, Zeke Hausfather and Glen Peters explained in Nature:
Emission pathways to get to RCP8.5 generally require an unprecedented fivefold increase in coal use by the end of the century, an amount larger than some estimates of recoverable coal reserves. It is thought that global coal use peaked in 2013, and although increases are still possible, many energy forecasts expect it to flatline over the next few decades. Furthermore, the falling cost of clean energy sources is a trend that is unlikely to reverse, even in the absence of new climate policies.
Encouragingly, private sector investment and policies that reduce emissions will likely further reduce the probability of a low probability, high impact event. Even so, one problem in the communication of climate research is the overrepresentation of RCP8.5 and the assumption of RCP8.5 as the business as-usual scenario. Roger Pielke Jr. (University of Colorado Boulder) and Justin Ritchie (University of British Columbia) “found almost 17,000 peer-reviewed articles that use the now-outdated highest emissions scenario. That scenario is also by far the most commonly cited in recent climate assessments of the IPCC and the U.S. National Climate Assessment. And every day new studies are published using outdated scenarios.”
This is not to suggest that RCP8.5 should be summarily dismissed from potential climate outcomes, but that it should not be depicted as business-as-usual when real world data concludes otherwise. As Pielke Jr. says, “Responding to climate change is critically important. So too is upholding the integrity of the science which helps to inform those responses.” Other mainstream climate scientists have also recommended that studies not treat worst-case scenarios as business-as-usual. Doing so miscommunicates the best available data and science and miscommunicates the likelihood of climate risk.
It is also worth noting that the lowest concentration pathway (RCP2.6) is also a likely unrealistic outcome. RCP2.6 would require changes in technology and policy that result in a dramatic and immediate reduction in greenhouse gas emissions. The more likely future scenarios are the RCP4.5 or RCP 6.0 pathways, which do not have climate cost projections as dire as RCP8.5 but are still of concern. A world that is 3 degrees Celsius above pre-industrial levels will very likely have substantial economic and societal costs with some regions faring much worse than others.
Another set of pathways climate models use are Shared Socioeconomic Pathways (SSPs). While RCPs are radiative forcing pathways, SSPs provide more detail into how emissions-driving inputs such as population growth, technological progress, economic growth, and other socioeconomic factors could change over time. The SSPs contain five specifically defined narratives (reference pathways) for how the world will change in absence of any climate policy. The SSPs include everything from a return to more economic nationalism across the world (which would be bad for emissions growth), widening income growth between rich and poor countries and expansions of technological progress through competitive markets. Hausfather explains that RCPs and SSPs “were designed to be complementary. The RCPs set pathways for greenhouse gas concentrations and, effectively, the amount of warming that could occur by the end of the century. Whereas the SSPs set the stage on which reductions in emissions will – or will not – be achieved.” SSPs can be valuable not just for understanding how many socioeconomic factors will change emissions and future warming trajectories but also how socioeconomic factors may obstruct or clear the way for climate mitigation and adaptation policies. With the inclusion of SSPs in the CMIP6 models, researchers have added more RCPs (RCP1.9, RCP3.4 and RCP7.0) to AR6.
Assessing Current and Future Climate Risk and Costs
The varying emissions trajectories and radiative forcing pathways provide a range of scenarios of how costly climate change may be through 2100. Of course, the climate won’t stop changing beyond 2100. The Wall Street Journal’s Greg Ip aptly summarized the prevailing climate science, noting, “On the encouraging side, the IPCC has dialed back the probability of (without ruling out) more extreme changes in temperature. Such scenarios have often been used to justify much faster and costlier action to ban or limit fossil fuels. On the sobering side, benign outcomes are also less likely, and uncertainty a less viable excuse for inaction.”
Current and future warming poses a risk. It is critical to assess the spectrum of that risk, the likelihood it may happen and to consistently evaluate how that risk and other probabilities change over time. Narrowing uncertainties can better inform about future risk and point toward better policy. Waiting too long may miss the opportunity to cost effectively reduce these risks. These questions are even more complicated when potential costs of public policy are front loaded and the challenge spans multiple generations and centuries.
Risk preferences vary across individuals and for activities in the present and in the future. People take on varying levels of risk when they choose to spend a day rock climbing, take a new job or invest for retirement 40 years down the road. We also know that events have different likelihoods of happening and varying degrees of costs associated with them. House fires and pandemics occur much less frequently than catching a cold, but cause much more damage in one single occurrence. A prudent step is purchasing insurance. In the case of a house fire, environmental economist Jonathan Adler writes, “You don’t install smoke alarms, acquire fire extinguishers, and buy home insurance because you expect a house fire. Rather, you recognize the value of insuring against low-probability/high-magnitude events. The costs and dislocation resulting from your house burning down are sufficiently grave that they justify prudent investments that will reduce the likelihood and the consequences of such an event.”
A risk-based, insurance approach is popular and sensible among conservatives and libertarians who want policy action on climate change. But there are few things to note with Adler’s analogy. Purchasing homeowner’s insurance may not be worth it if the premiums are too high or greater than the value of the insurance. Generally, though, homeowners willingly pay because on the off chance a fire destroys their home, the insurance will appropriately compensate them. Adler’s other two examples of installing smoke alarms and buying fire extinguishers are two low-cost options that provide a lot of value.
It is important to consider what policies provide good value for climate risk reduction – both to further reduce the chances of high impact/low probability scenarios but to also the risk and cost of more likely scenarios that will still likely result in considerable costs. The business-as-usual likelihood of 3 degrees Celsius (and possibly higher) is still concerning. What we do not know should be treated as higher risk; how much higher is a question of risk preferences we are (and should be) willing to tolerate as a society.
With respect to climate change, policies that increase energy bills or restrain economic prosperity must be weighed against how much insurance we’re buying for that premium. We must evaluate whether specific policies will reduce risk and improve adaptability and weight that against the costs. At the very minimum, policymakers must explore “win-win” policies that unlock investments in cleaner, more efficient technologies, raise standards of living, reduce emissions, and improve adaptability. There are plenty of ways to engage in climate policy where the premiums are essentially free or very low-cost.
Integrated assessment models attempt to quantify the additional social cost of emitting an additional ton of carbon dioxide into the atmosphere. Attempts to forecast economic damages out to the year 2300 significantly strain the credibility of these models. Economic models have a difficult enough time forecasting several years into the future, let alone decades or centuries. Changes in discount rates, which are useful tools to compare costs and benefits when they occur at different times, change the value of the social cost of carbon dioxide and other greenhouse gases. Studying intergenerational costs and benefits is critical for a variety of major public policy issues, whether it be social security, health care, national security, or
government debt. The same holds true for climate policy.
We can also use economic models to assess the costs, benefits and unintended consequences of energy and climate policies. The cost could be direct, paid by taxpayers and energy consumers. It could be indirect, resulting in shrinking economic growth and distorted competitive markets. The benefits would ostensibly reduce the risk and future cost of climate change through mitigation and adaptation. When you buy insurance, you want to know how much protection you’re receiving and at what price. If we’re buying climate insurance, it’s essential to ask the same questions.
Extreme Weather and Resource Disruption
No matter the cause, extreme weather and resource disruption can have devastating impacts on communities. They claim lives, destroy livelihoods, and disrupt normalcy. Whether it is a wildfire in Colorado, a hurricane ravaging the Gulf Coast, or the rapid depletion of a critical water resource, the impacts can be catastrophic. Bad policy exacerbates the risks and costs of extreme weather. Poor planning, overly burdensome permitting timelines, socialized risk, and failed coordination misallocate resources and inhibit the ability communities have to adequately prepare and respond to natural disasters.
Conversely, objective and transparent science can inform public policymaking. Scientific knowledge is vital to help communicate our understanding of climate change and extreme weather. The improvement of detection and attribution science will better inform policymakers about the effects of anthropogenic activity on natural disasters. Further, climatologists may be able to better estimate the likelihood and intensity of an extreme weather event. Certainly, there are limitations with attribution science, including “limitations of observations, models, statistical methods, process understanding for extremes, and uncertainties about the natural variability of extremes.”
Chapter 11 of the AR6 provides thorough analysis of observed trends and the detection and attribution of extreme weather events. The chapter also projects anticipated changes of extreme weather at a global and regional level, and it does so with varying degrees of likelihood and confidence.
Humility in communicating the uncertainties and veracity in attribution and forecasting is critical as to not misinform the public and policymakers about the risk posed to communities. Some issues may seem to be straightforward, but chances are they are highly complex. Overstating or oversimplifying one factor and understating other factors (climate, natural, political, social, and economic) could misrepresent the true context and consequently result in costly, ineffective policy.
Before digging into some extreme weather data, it is helpful to understand the terminology the authors use to describe uncertainty. The IPCC expresses uncertainty quantitatively and qualitatively. Quantitative assessments “are expressed probabilistically and are based on a combination of statistical analyses of observations or model results, or both, and expert judgement.” The qualitative confidence assessment “results from the type, amount, quality and consistency of evidence and the degree of agreement in the scientific studies considered.”
Climate change is a global phenomenon, and detection and attribution have been identified for certain extreme weather events and not identified for other events in AR6.79 Detection and attribution of anthropogenic warming’s effect on extreme weather has improved from previous reports. The IPPC’s definitions are:
● Attribution is defined as the process of evaluating the relative contributions of multiple causal factors to a change or event with an assessment of confidence.
● Detection of change is defined as the process of demonstrating that climate or a system affected by climate has changed in some defined statistical sense, without providing a reason for that change. An identified change is detected in observations if its likelihood of occurrence by chance due to internal variability alone is determined to be small, for example, <10%.
A more helpful way of thinking through climate change and extreme weather is not through absolute numbers on frequency and intensity but on how anthropogenic warming influences probabilities. Climatologists seek to continue to understand how recent warming is (or isn’t) exacerbating extreme weather. Table 6.2 of the IPCC’s IPCC Special Report on the Ocean and Cryosphere in a Changing Climate shows how climatologists have analyzed various natural disasters and extreme weather hazards and explains whether there was any attribution to anthropogenic climate change or if it was unknown.
Importantly, regional details provide necessary context for how communities grapple with present and future changes in climate patterns and extreme weather. While there may be no long-term trends in specific extreme weather events globally, some regions will be more affected than others and are, in fact, experiencing a trend.
Even if a trend in frequency or intensity ceases to exist, however, that does not mean climate change caused by human activity had no effect. Anthropogenic warming may increase the probability of a heat wave, increase the duration of a wildfire season, or shift the likelihood that a tropical cyclone becomes more intense (by giving a storm more energy) and the location of where it may reach its peak intensity. Manmade warming could also reduce aspects of hurricane intensification by changing the strength of certain winds. Climatologist Joseph Majkut contends, “No weather event is unaffected by climate change. But the effects of climate changes on storms and drought and other phenomena vary by region. Given the episodic nature of weather, changes that are predicted by physics may not be statistically detectable for some time. Even with physical and theoretical understanding, predictions for some phenomena have substantial uncertainty.”
Climatologists use a combination of observed records and satellite data spanning several decades and use climate science models to estimate what may have happened in a world without human-induced warming. Scott Denning, professor of atmospheric sciences at Colorado State University, says we should keep two things in mind: “First, humans have pumped so much carbon dioxide and other planet-warming greenhouse gases into the atmosphere that what’s ’normal’ has shifted. Second, not every extreme weather event is connected to global warming.”
How does this play out on the data on extreme weather? On floods, AR6 says there is low confidence for any trends in frequency or intensity of floods at the global scale. Regionally, however, “there are regions experiencing increases, including parts of Asia, southern South America, the northeast USA, northwestern Europe, and the Amazon, and regions experiencing decreases, including parts of the Mediterranean, Australia, Africa, and the southwestern US.” Looking at droughts, AR6 categorizes trends, human impact and forecasts for four different types of droughts:
- meteorological (precipitation deficits)
- agricultural (soil moisture deficits that reduce crop yields)
- ecological (related to plant water stress and
- hydrological droughts (water shortage in streams or storages such as reservoirs, lakes, or groundwater).
AR6’s entire section on droughts and similar events demonstrates the complexity and challenge of examining human-induced
warming’s effect on droughts, not only at a global and regional level but also for a single event. For instance, while there is
stronger evidence that anthropogenic warming has contributed to soil moisture deficits, in many regions land use changes
and human water management contribute more to hydrological droughts. Consequently, there is “limited evidence and thus
low confidence in assessing these trends at the scale of single regions, with few exceptions.”
In summary, AR6 asserts that:
[H]uman influence has contributed to changes in water availability during the dry season over land areas, including decreases over several regions due to increases in evapotranspiration (medium confidence). The increases in evapotranspiration have been driven by increases in atmospheric evaporative demand induced by increased temperature,
decreased relative humidity and increased net radiation over affected land areas (high confidence). There is low confidence that human influence has affected trends in meteorological droughts in most regions, but medium confidence that they have contributed to the severity of some single events. There is medium confidence that human-induced climate change has contributed to increasing trends in the probability or intensity of recent agricultural and ecological droughts, leading to an increase of the affected land area. Human-induced climate change has contributed to global-scale change in low flow, but human water management and land use changes are also important drivers (medium confidence).
The data on the frequency and intensity of tropical cyclone [TC] activity is another example of how climatologists are learning from trends to improve data quality and modeling capabilities. More informative science allows climatologists to attach attribution and forecasts of tropical cyclones with varying degrees of certainty. As indicated by AR6, there is no trend in the frequency or intensity of tropical cyclone activity over the past 40 years. A 2018 article in the American Meteorological Society journal shows that there has been no increase in trends for frequency or intensity of land-falling hurricanes in the continental U.S. since 1900.
Historically, recordkeeping on tropical cyclones only dates back about 100 years. Yet, as the IPCC’s Assessment Reports readily acknowledge, there are challenges in measuring how tropical cyclones have changed over time because of the heterogeneous quality of long-term data. For example, as MIT’s Kerry Emmanuel’s July 2020 commentary in the Proceedings of the National Academy of Sciences (PNAS) notes that even though we have longer-term records on tropical cyclone satellite data, surface area wind speeds are difficult to monitor from so far away. Over time, satellite technologies have improved to measure that data more accurately.
He points to a PNAS study by lead author James Kossin that uses newer satellite technologies and homogenizes that data with older satellite data to create a 39-year period (1979–2017) to measure changes in intensity. In statistically significant findings, Kossin and his co-authors conclude: “a global increase of about 8% per decade of the probability that a given tropical cyclone will become a major storm.” Changes in rainfall and sea level rise, which increase the risk of storm surge, both factor in to probabilistically make hurricanes more damaging. Warmer sea surface temperatures intensify hurricanes, and sea surface temperatures are warmer from manmade warming, aerosol forcings and in part because of natural variations known as the Atlantic Multi-Decadal Oscillation. In summary AR6 concludes,
[I]t is very likely that the recent active TC seasons in the North Atlantic, the North Pacific, and Arabian basins cannot be explained without an anthropogenic influence. The anthropogenic influence on these changes is principally associated to aerosol forcing, with stronger contributions to the response in the North Atlantic. It is more likely than not that the slowdown of TC translation speed over the USA has contributions from anthropogenic forcing. It is likely that the poleward migration of TCs in the western North Pacific and the global increase in TC intensity rates cannot be explained entirely by natural variability. Event attribution studies of specific strong TCs provide limited evidence for anthropogenic effects on TC intensifications so far, but high confidence for increases in TC heavy precipitation. There is high confidence that anthropogenic climate change contributed to extreme rainfall amounts during Hurricane Harvey (2017) and other intense TCs.
Looking forward, it is likely the planet may face fewer but more intense hurricanes. In a review of the literature and in conducting its own analysis, the NOAA’s Geophysical Fluid Physical Laboratory says “that it is premature to conclude with high confidence that increasing atmospheric greenhouse gas concentrations from human activities have had a detectable impact on Atlantic basin hurricane activity.” It also concludes “that it is likely that climate warming will cause Atlantic hurricanes in the coming century have higher rainfall rates than present-day hurricanes, and medium confidence that they will be more intense (higher peak winds and lower central pressures) on average.” NOAA finds the same globally and also found a poleward shift for where tropical cyclones heat peak intensity in recent decades, though not in the Atlantic basin.
Wildfires are yet another example where many factors influence the size and severity of an extreme weather event. Globally and nationally, data exhibit a declining trend for more than a century in the number of acres burned, but U.S. data exhibit an increasing trend in acres burned over the last 40 years.
Declining trends in acres burned is good news, but we’re also putting ourselves more at risk. According to the AR6: “There is medium confidence that weather conditions that promote wildfires (fire weather) have become more probable in southern Europe, northern Eurasia, the US, and Australia over the last century.” Importantly: “There is high confidence that compound hot and dry conditions become more probable in nearly all land regions as global mean temperature increases. There is high confidence that fire weather conditions will become more frequent at higher levels of global warming in 30 some regions.”
Focusing on the United States, the western states have become hotter and drier and states’ wildfire seasons are longer and will very likely grow even longer. One study out of UCLA estimates that the number of days with extreme fire weather in the fall has more than doubled over the past 40 years.100 Another study in Earth’s Future found similar results for warming’s effect on fuel drying, but noted that a changing climate has not affected wind or precipitation patterns. Soil moisture is another factor that determines how severe a wildfire might be.102 Droughts can be both bad and good for wildfires. Droughts create a dry climate for vegetation to burn, but extended droughts can result in less fire because, as NASA’s Ben Cook points out, “the vegetation will not grow back as vigorously, and you may run out of fuel to burn.”
Changes in wind patterns and intensity cause the most catastrophic losses because they make fires difficult to contain and more likely to reach places where people live. Some parts of California, such as the area where the Camp Fire wildfire occurred in 2018, saw no discernible trend in fuel moisture or precipitation, but the winds were strong enough to dry out the vegetation anyway. A place like California is known for intense winds, such as the Diablo winds in the north and the Santa Ana winds in the south. Some studies show that warming could reduce the frequency of the Santa Ana winds and potentially weaken the pressure of Diablo winds. If precipitation patterns change, however, that merely might push the wildfire season from the fall into the winter.
The fuel load is another vital contributor to wildfire size and intensity. Without proper management, whether prescribed burns or timber harvesting, forests can become tinder boxes comprised of dry trees, grass, and shrubs. Invasive species, including grasses and shrubs, may also contribute to worse wildfires because they dry out and have a higher likelihood of burning than native plants.106 Better land management has long been understood as a necessity to reduce the severity of fires. Malcolm North of the U.S. Forest Survey says: “Climate dries the [wood] fuels out and extends the fire season from four to six months to nearly year-round. [B]ut it’s not the cause of the intensity of the fires. The cause of that is fire suppression and the existing debt of wood fuel.”
Whether it is a hurricane or a wildfire, the challenge and the imperative is to communicate the complexity of factors that cause extreme weather, how those factors interact with one another, and to communicate the varying degrees of certainty.
One final point on extreme weather: multiple things can be true when interpreting the data. The analysis of extreme weather has become one of the more polarizing topics among climate science skeptics, climate alarmists, and most everyone in-between. Depending on how someone conveys the information, a heat wave or wildfire is either evidence that climate change is a present emergency or that long-term trends fail to indicate any increased frequency or intensity for most extreme weather events. One can pick certain beginning and end points to craft a narrative that fits what one wants to show about extreme weather trends or human attribution. But the overall trends show there has been no noticeable increase in the number of “hot days” in the United States (measured by temperatures reaching 100 degrees F or 105 degrees F).108 Heat waves were worse in the 1930s. That said, human-driven warming has made heat waves today worse, more probable, and more likely in the future. The IPCC concludes, “Changes include increases in both land and ocean temperatures, as well as more frequent heatwaves in most land regions (high confidence). There is also high confidence that global warming has resulted in an increase in the frequency and duration of marine heatwaves.”
Narrative crafting through tailored presentation of the data is unhelpful. Climate change is complex. Human, natural influences, and other non-climate factors all influence how the planet changes over time. Many uncertainties exist in climate science literature. But climate scientists are virtually certain in other areas. The best available information on observed data at global, regional, and local scales and forecasts about the frequency and intensity of extreme weather are important for assessing risk and weighing the costs and tradeoffs of public policy.
Conclusion
We conclude this primer as we began it: with a few words from David Wallace-Wells. In his October 2022 article “Beyond Catastrophe” in the New York Times, Wallace-Wells writes, “The window of possible climate futures is narrowing, and as a result, we are getting a clearer sense of what’s to come: a new world, full of disruption but also billions of people, well past climate normal and yet mercifully short of true climate apocalypse.”
Even with the clearer picture of our climate future and the well-established scientific fact that human-induced warming affects the planet, there is a great deal of uncertainty communicated in the mainstream body of climate science and climate literature. The way in which climate science experts communicate the science, the risks, and the uncertainties is critical to earning the trust of the public and best informing policymakers. “Trust the science” is becoming a charged phrase, but the reality is the current scientific understanding does not support catastrophic alarmism or climate science denialism. A risk-based policy approach that tackles climate change with urgency and optimism is needed to help move the needle on societal and climate progress.
It Costs More To Permit Infrastructure Than To Build It — But One Lawmaker Wants To Change That
Drew Bonds writes about America’s broken permitting process for the Washington Star. “A project